Compressor Consolidation ROI: Real Facility Case Study
10th May•13 min read

Multi-site compressor optimization and fleet management ROI are no longer luxury considerations - they're survival metrics for any operation running more than one compressor or managing compressed air across multiple locations. If you're running separate systems at different facilities, different zones in a large shop, or networked compressors powering different tool stations, you're likely leaving thousands on the table each year through fragmented pressure management, duplicated inefficiencies, and invisible pressure drops that rob you of real tool performance.
The principle is simple: finish quality and tool reliability are system results. Most shops and multi-location operations optimize individual compressors in isolation. They fail to trace pressure drop across hoses, regulators, and distribution lines. They run maintenance schedules on a calendar, not on actual air demand. They pay the bill without benchmarking energy use against output. The result is that the compressor delivering air to your spray gun, impact wrench, or sander is often running hot, working harder than it should, and feeding you air far dirtier and at lower pressure than rated.
This guide is structured around one hard principle: clean, dry, stable air makes finishes look inevitable - and saves money predictably.
In the context of small businesses, trades, and distributed operations, "multi-site" typically means one of three scenarios:
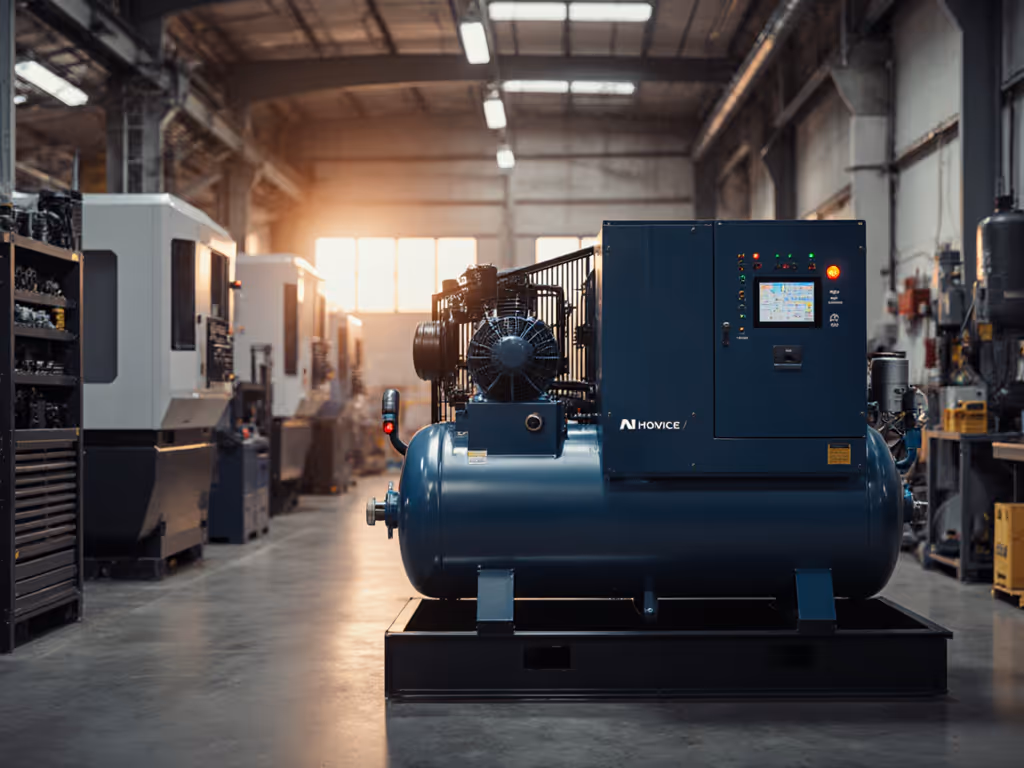
In each case, optimization isn't about buying a fancier machine. It's about centralized compressor management - coordinating pressure, flow, and air quality so that every tool downstream gets what it actually needs at the moment it needs it. A real-world paper mill case documented by compressed-air management specialists illustrates the point: four compressors running at one facility were consuming 650 HP continuously. By installing load-sharing logic and a custom trim algorithm that analyzed real-time inlet valve position and discharge pressure, plant managers turned off an average of 650 HP - reducing annual runtime by 8,000 hours and saving $284,000 annually at a $.065/kWh electric rate. The payback period was just 4.7 months.
For a small business running two or three compressors, similar gains are within reach. The method is the same: measure what's actually happening, eliminate guesswork, and let data drive your decisions.
One of the most overlooked culprits in multi-site systems is pressure drop across plumbing, hoses, regulators, and filter stages. I once worked with a body shop that was getting fish-eyes and hesitation in their HVLP spray pattern despite running a compressor rated at 100 PSI. We measured at the tank - 100 PSI steady - and then traced pressure at the spray gun. It read 28 PSI at the trigger. Ninety percent of the available pressure was being lost in the lines.
The diagnosis: undersized hose, wet air lines (no desiccant tower), and a single regulator mounted three stations away from the gun. We installed a desiccant tower for moisture removal, replaced the hose with the right internal diameter for the CFM demand, and mounted a regulator at the handle. If you're selecting a dryer, compare air dryer technologies to hit your target dew point without overspending on energy. Next week, rejects fell by 90 percent.
In a multi-site or multi-compressor system, this penalty multiplies. Each location, each hose run, each regulator placement compounds the loss. Here's why it matters:
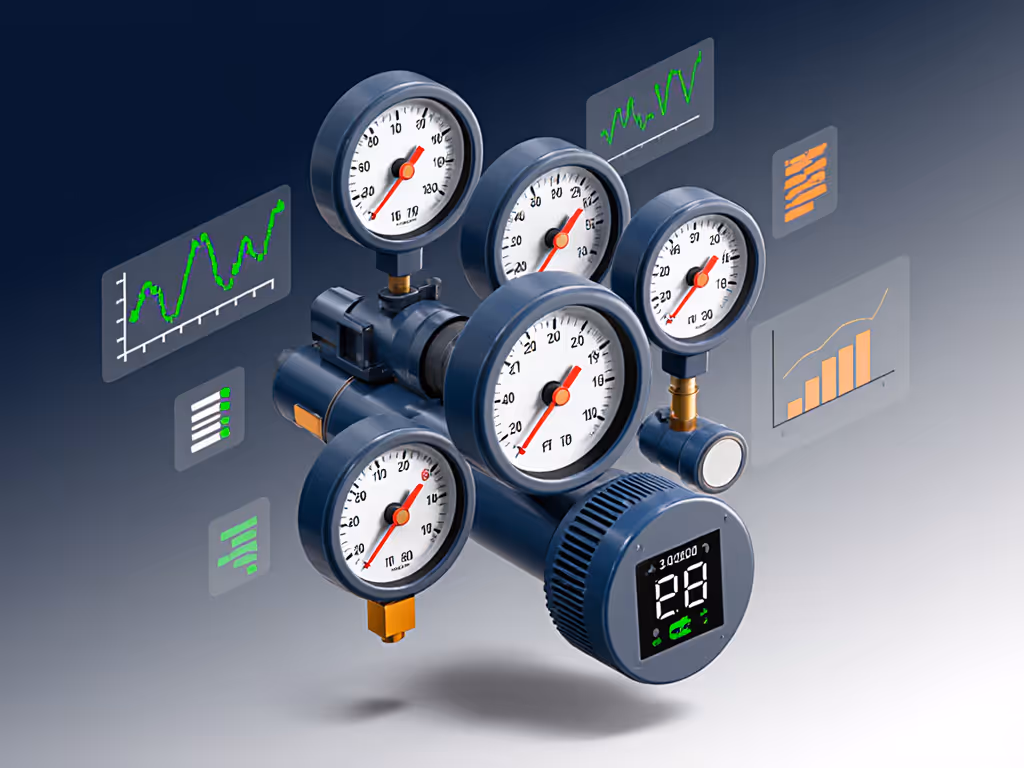
Trace the pressure drop at every stage:
For multi-site operations, create a pressure-tracing log for each location and each major tool station. Record pressure at five points: tank outlet, after main dryer, at regulator inlet, at regulator outlet, and at tool inlet. Do this when the compressor is at load and during typical tool use. Repeat monthly. Any location showing >15 PSI drop from tank to tool requires investigation.
One compressor running flawlessly while another at the same company is struggling suggests protocol drift. Without standardized maintenance, each location interprets 'change the filter' differently, drain schedules slip, and nobody documents when a regulator was last serviced. For interval-by-interval guidance, see our Air Compressor Maintenance Schedule.
Implement a centralized maintenance log that covers all sites and tracks:
Assign one person or team as the "air quality auditor" for your organization. Their job is to move between sites monthly, collect the logs, verify compliance, and flag any anomalies. When a location drifts, you catch it before a tool fails or a finish is compromised.

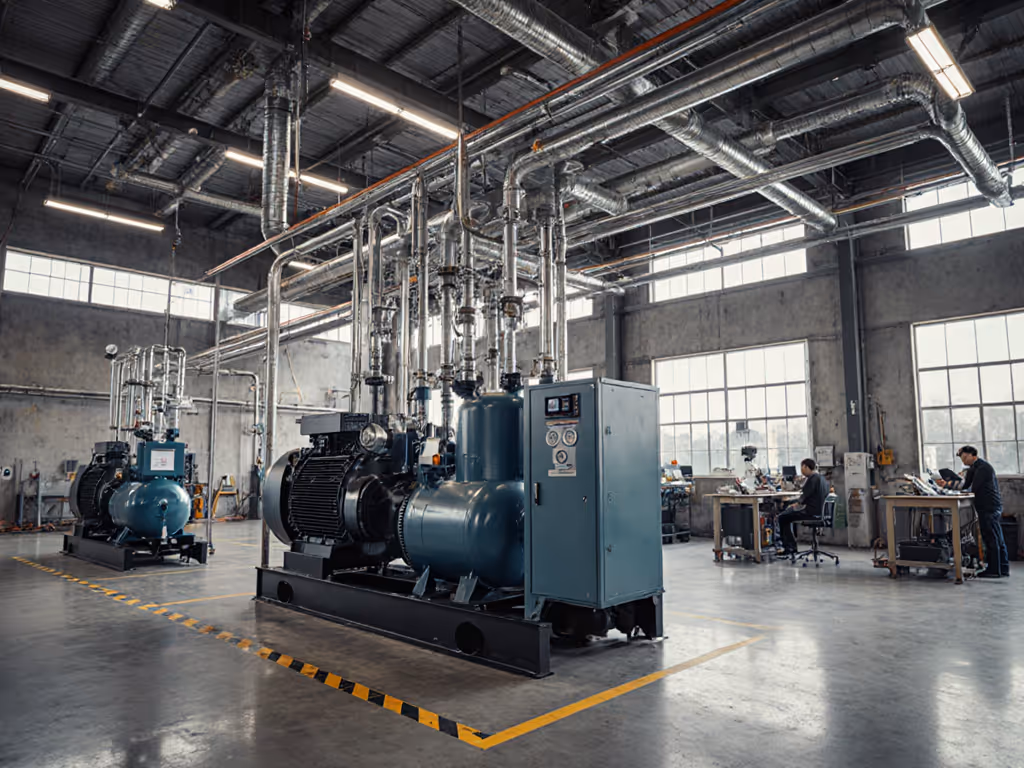
Electricity is often the biggest variable cost in compressed-air operations. Yet most shops never measure it. They pay the bill and assume the compressor is working efficiently.
Energy benchmarking is the discipline of measuring energy input (kilowatts) against air output (CFM at working pressure) to spot inefficiency trends. Here's how to set it up:
For each compressor at each site, record:
Calculate specific power consumption: kW input ÷ CFM output at working pressure. Industry benchmarks for rotary-screw compressors range from 4.5 to 6.5 kW per 100 CFM at 7 bar (100 PSI). If your site is consuming 7.5 kW per 100 CFM, something is wrong - fouled aftercooler, leaking unload valve, or worn compressor head. For a deeper comparison of drive types and savings potential, read VSD vs fixed speed.
Install a simple power meter on each compressor's electrical circuit (or use utility data if it's isolated). Track:
When cost per CFM creeps up, investigate. Common culprits:
For a small business running three compressors, energy benchmarking often uncovers a $1,500-3,000 annual saving just by identifying one compressor running consistently hot or one location with significant leakage.
Once you have data, you can optimize intelligently. This is where the paper mill example becomes directly applicable to smaller operations: load-sharing logic and trim algorithms minimize wasted capacity.
The principle: If you have a 10 HP primary compressor and a 5 HP standby, don't run both simultaneously at partial load - you waste energy. Instead:
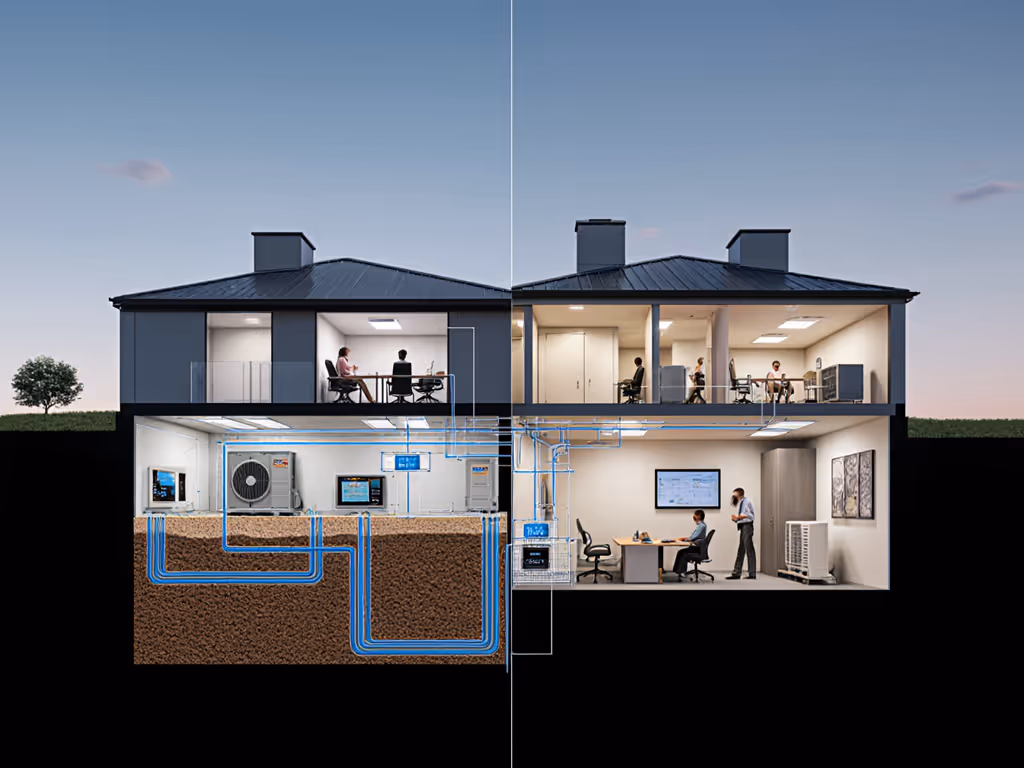
For multi-location operations, the same principle applies geographically:
This approach reduces energy waste, extends compressor lifespan by minimizing part-load inefficiency, and ensures that no single compressor is starved of air during peak demand.
Modern air-management platforms (such as the CAMLink Online system referenced in the paper mill case) allow remote monitoring, predictive alerts, and automated load-sharing logic. To understand the sensors and data flow behind these platforms, see IoT compressor technology. For small to mid-size operations, the entry point is simpler: a pressure transducer and a basic data logger at each compressor location, with daily or weekly log-file uploads to a shared cloud folder.
What to monitor centrally:
Set alerts for:
When an alert fires, the responsible technician gets a text. This is far superior to discovering a failed compressor when a critical tool stops working mid-job.
Let's translate the paper mill savings to a realistic small-business scenario:
Scenario: A three-location painting and drywall service company.
After optimization:
Result: Effective power draw reduces by ~25%. New annual energy spend: ~$20,088/year. Annual savings: $6,696.
Maintenance savings: Reduced runtime (from 16 to ~13 hours/day equivalent full-load) and earlier detection of problems mean fewer unexpected failures. Estimate a 15% reduction in maintenance costs: ~$1,200/year.
Downtime avoided: One fewer mid-job compressor failure means no lost jobs and no emergency weekend calls. Conservatively valued at $2,000-5,000/year.
Total first-year ROI: $9,896-12,896. If optimization hardware and setup cost $5,000-8,000, you break even in 5-8 months and pocket $4,000-8,000 in year one.
Start small. You don't need a data-logging system on day one. You need discipline.
Multi-site compressor optimization is not about buying bigger machines or running them harder. It's about closing the gap between rated performance and actual system delivery. It's about understanding that pressure drop, moisture, and energy waste are interconnected - fix one and the others improve.
The shops and multi-location operations that win are the ones that measure, log, and act on data. They know their baseline, they spot drift, and they trace pressure drop before it becomes a finish failure or a tool breakdown.
Clean, dry, stable air makes finishes look inevitable - and it also makes ROI inevitable. A small business that cuts energy spend by 20%, reduces unplanned downtime, and eliminates pressure-starvation complaints in a single quarter doesn't just save money. It saves time, stress, and reputation.
Schedule a half-day pressure audit at your primary location or compressor. Use a clamp ammeter, a pressure gauge, and a stopwatch. Measure:
Document every number. Send it to the person responsible for maintenance at each other location and ask them to do the same. Compare the results. Pressure readings that vary by >10 PSI between locations, or amps that are 15% higher on one compressor than on an identical model, are red flags.
They're the starting point for your optimization roadmap - and your first $5,000-10,000 in annual savings.